⛅ Weather ▼
| National Forecast Maps/Weather Hazard Information | ||
| National Forecast Maps | ||
 |
 |
 |
|
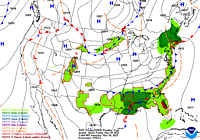
Short range forecast products depicting pressure patterns, circulation centers and fronts, and types and extent of precipitation.. |
Medium range forecast products depicting pressure patterns and circulation centers and fronts |
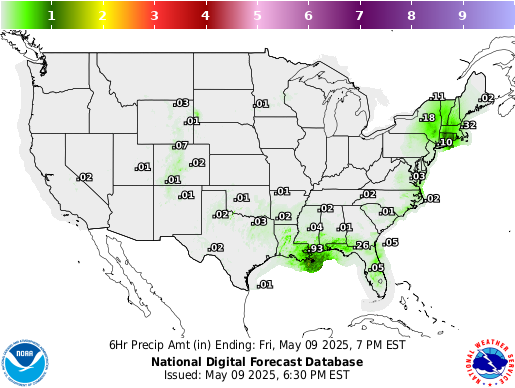
Quantitative precipitation forecasts. |
 |
 |
 |
|
Highs, lows, fronts, troughs, outflow boundaries, squall lines, drylines for much of North America, the Western Atlantic and Eastern Pacific oceans, and the Gulf of Mexico. |
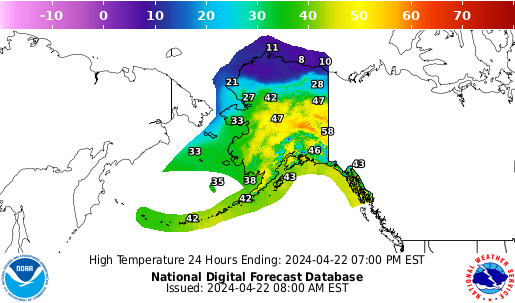
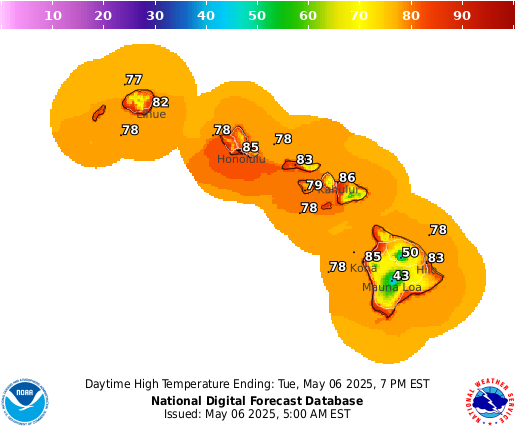
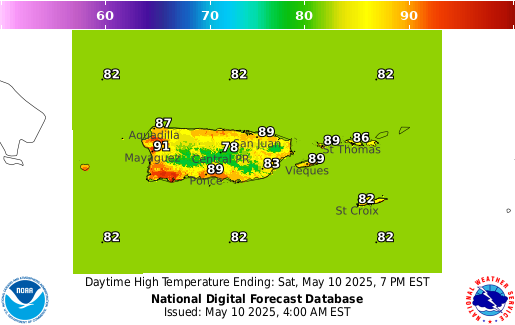
Maximum daytime or minimum overnight temperature in degrees Fahrenheit. |
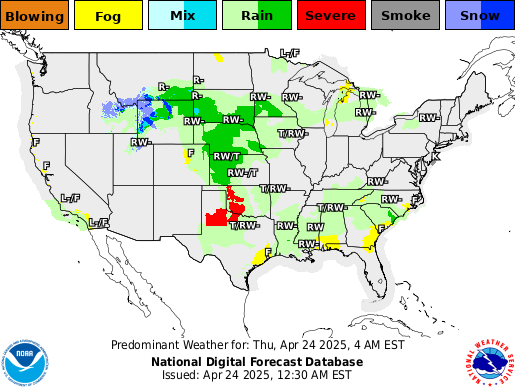
Expected weather (precipitating or non-precipitating) valid at the indicated hour. The weather element includes type, probability, and intensity information. |
 |
 |
 |
|
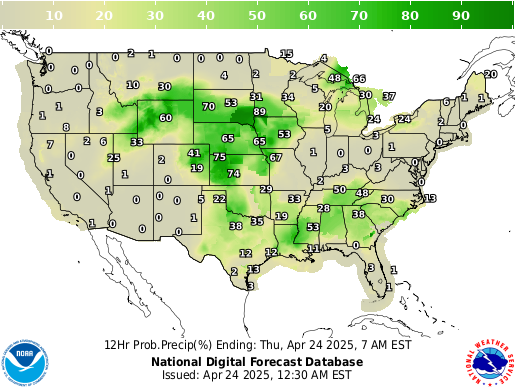
Likelihood, expressed as a percent, of a measurable precipitation event (1/100th of an inch). |
Total amount of expected liquid precipitation. |
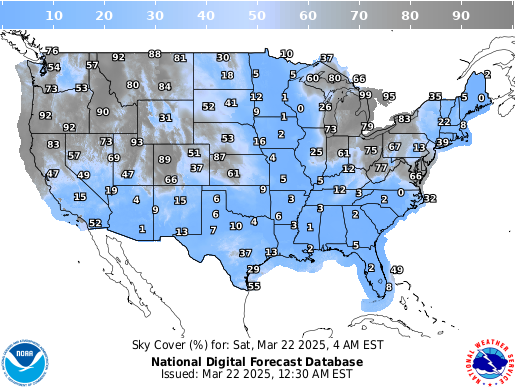
Expected amount of opaque clouds (in percent) covering the sky. |
 |
 |
 |
|
Graphical forecasts from the |
Graphical forecasts from the National Digital Forecast Database for Hawaii. |
Graphical forecasts from the National Digital Forecast Database for Puerto Rico and Virgin Islands. |
| Weather Hazard Information | ||
|
|
|
|
| Air Quality ▪ Forecast Info
|
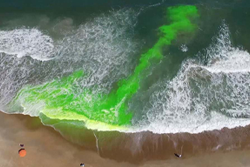
Beach Hazards ▪ Forecast Info
|
Cold |
|
|
|
 |
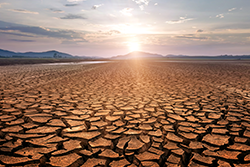
| Drought |
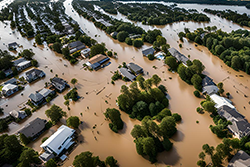
Floods |
Fog |
|
|
|
|
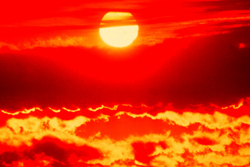
| Heat ▪ Forecast Info
|
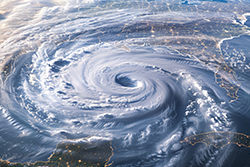
Hurricanes ▪ Forecast Info
|
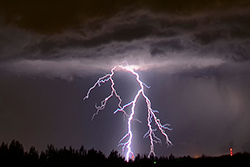
Lightning ▪ Forecast Info
|
|
|
|
|
| Rip Currents ▪ Forecast
|
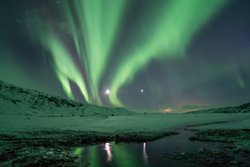
Space Weather ▪ Forecast Information
|
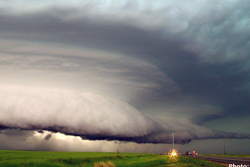
Thunderstorms ▪ Forecast Information
|
|
|
|
|
| Tornado ▪ Forecast Information
|
Tsunamis ▪ Forecast Information
|
Wildfire ▪ Forecast Information
|
|
|
 |
|
| Wind ▪ Forecast Information
|
Winter ▪ Forecast Information
|
|
| Information courtesy of weather.gov | ||


Tranmautritam at Pexels
